
Making Word Clouds from Hotel Reviews (R)
A few weeks ago, I stumbled upon a very interesting database on Kaggle. The dataset is a collection of over 20,000 hotel reviews from Tripadvisor. As someone who loves to travel, I think it’s a goldmine. The last time I went to a hotel was last July in the Algarve. During my first night there, someone knocked on my door at 2:00AM. My room had no phone and the lobby was closed due to the pandemic. Of course, I didn’t go to the door or make a sound. Maybe that’s why I’m still writing this post…
Part 1: Data exploration
There isn’t too much to explore since we only have two variables, but let’s begin. The dataset is in csv format so this will be straightforward:
#first we load our data and call it d1:
d1 <- read.csv("tripadvisor_hotel_reviews.csv")

#now we can view the structure of our dataset:
str(d1)
## 'data.frame':    20491 obs. of  2 variables:
##  $ Review: Factor w/ 20491 levels "1 best hotels new york, hotel absoutly brilliant..."
| __truncated__,..: 14068 15694 14577 19374 9883 12187 3097 4563 11252 4617 ...
##  $ Rating: int  4 2 3 5 5 5 5 4 5 5 ...
From the structure, we can see that d1 has a total of 20,491 reviews. R has treated each review as a different factor, but this will not be too important once we prepare our dataset. Meanwhile, the ratings are a numeric variable. Tripadvisor has a discreet scale from 1 to 5, where 5 is a perfect hotel score given by users. For descriptive purposes, let’s see some statistics on the hotels ratings:
#We will start with a summary of the ratings:
summary(d1$Rating)
##    Min. 1st Qu.  Median    Mean 3rd Qu.    Max.
##   1.000   3.000   4.000   3.952   5.000   5.000
As expected, the max is 5 and the min is 1. The mean is quite close to 4 which tells us either most hotels are good and/or users tend to post more positive experiences. Next we will tabulate the frequencies for each rating:
#to do this we simply use table():
table(d1$Rating)
##
## 1 2 3 4 5
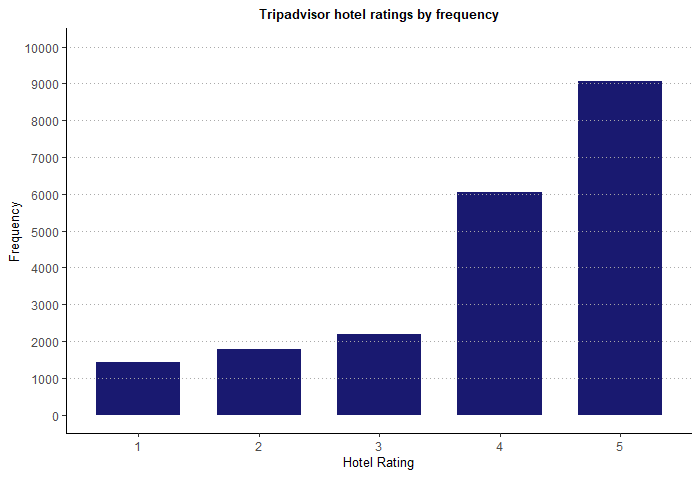
## 1421 1793 2184 6039 9054
Most ratings fall between 4 and 5 stars. Again, this could mean people report more positive experiences than bad. Let’s summarize this in a nice bar graph:
#loading ggplot2:
library(ggplot2)

#making our base plot:
p1 <- ggplot(d1, aes(x=factor(d1$Rating)))+
  geom_bar(stat="count", width=0.7, fill="midnightblue")

#adding some extra customization:
p1 + ylab(c("Frequency"))+xlab(c("Hotel Rating"))+
  ggtitle(c("Tripadvisor hotel ratings by frequency"))+
  theme_classic()+ scale_y_continuous(breaks = (seq(0,10000,1000)))+
  geom_hline(yintercept=(seq(1000,10000,1000)),colour='darkgrey',
             linetype="dotted")+
  theme(plot.title = element_text(size = 10,face = "bold",hjust = 0.5),
        axis.title = element_text(size=10))
The customization is just a bit of extra work to make the base plot more presentable. Now we can move on to the data preparation for the reviews variable.
Part 2: Preparing our text variable
The reviews variable contains only text so the manipulation is a bit different. For a great start on how to process text data see Langtz (2013, pg. 104). In order to do this, we will be using the tm package. I am by no means an expert, for a more complete tutorial you can check out this great RPub.
#we start by loading the tm package:
library(tm)

#now we will create a corpus, a special object for working with text:
reviews_corpus <- Corpus(VectorSource(d1$Review))

#we can use inspect() to view the first element of the corpus:
inspect(reviews_corpus[1])
## <<SimpleCorpus>>
## Metadata:  corpus specific: 1, document level (indexed): 0
## Content:  documents: 1
##
## [1] nice hotel expensive parking got good deal stay hotel anniversary, arrived late evening took advice previous reviews did valet parking, check quick easy, little disappointed non-existent view room room clean nice size, bed comfortable woke stiff neck high pillows, not soundproof like heard music room night morning loud bangs doors opening closing hear people talking hallway, maybe just noisy neighbors, aveda bath products nice, did not goldfish stay nice touch taken advantage staying longer, location great walking distance shopping, overall nice experience having pay 40 parking night,
This is the first complete review. Next, we will need to perform some text cleaning using tm_map(). This function allows us to remove punctuation and other characters that may clutter the word clouds. Additionally, we can also remove filler or stop words like to, and, but, or, etc. Instead of making a list of stop words ourselves, we can use the default stopwords():
#first we will change all of the words into lower case:
corpus_clean <- tm_map(reviews_corpus, tolower)

#next we remove any numbers:
corpus_clean <- tm_map(corpus_clean, removeNumbers)

#removing the stopwords:
corpus_clean <- tm_map(corpus_clean, removeWords, stopwords())

#now we take out punctuation:
corpus_clean <- tm_map(corpus_clean, removePunctuation)

#lastly, we leave only a single space between words:
corpus_clean <- tm_map(corpus_clean, stripWhitespace)

#now we can see the difference:
inspect(corpus_clean[1])
## <<SimpleCorpus>>
## Metadata:  corpus specific: 1, document level (indexed): 0
## Content:  documents: 1
##
## [1] nice hotel expensive parking got good deal stay hotel anniversary arrived late evening took advice previous reviews valet parking check quick easy little disappointed nonexistent view room room clean nice size bed comfortable woke stiff neck high pillows soundproof like heard music room night morning loud bangs doors opening closing hear people talking hallway maybe just noisy neighbors aveda bath products nice goldfish stay nice touch taken advantage staying longer location great walking distance shopping overall nice experience pay parking night
Now we have a simpler piece of text with only the most essential words. However, this is still quite a long piece of text and it’s only 1 out of 20,000 reviews. This is why word clouds are a great visualization tool for this sort of data. By grouping the most frequently used words, we can see what guests value when it comes to their hotel stays.
Part 3: Making a Word Cloud
The process of making a word cloud is quite simple once we have a clean corpus. To do this we will use the wordcloud package and later apply a color pallette from the RColorBrewer package:
#We will use the following packages:
library(wordcloud)
library(RColorBrewer)

#Now we can generate a basic word cloud using the corpus_clean object,
#min.freq is the minimum frequency we want to present
#by setting it to 1 we want to count all the words
#max.words will limit the words presented to 200
#we set the random order to false
#this means the most important words will be in the middle
wordcloud(corpus_clean, min.freq=1, max.words=200, random.order = FALSE)
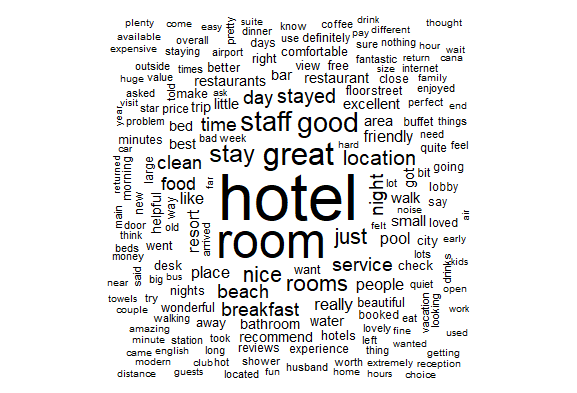
Unsuprisingly, the most frequent word in the reviews is hotel, followed by room. Note how the default word cloud puts all the words in black. We can improve this by adding color and manually removing a few words we are not interested in, like hotel, good, great, excellent, just, place, etc. This is a subjective decision but I want to focus on features that guests value:
#first we create a new corpus and remove specific words:
corpus2 <- tm_map(corpus_clean, removeWords,
                          c("hotel","good","great","excellent","just","place",
                            "away","time", "stay",
                            "stayed", "rooms","like",
                            "night","beautiful","day",
                            "nice","best","really","got"))

#now we make a new word cloud, with the same limits
#we will also add a categorical color pallet from RColorBrewer
#and adjust the placement of words with rot.per:
set.seed(345)
wordcloud(corpus2, min.freq = 1,max.words=200,
          random.order=FALSE, rot.per=0.20,
          colors=brewer.pal(8, "Dark2"))
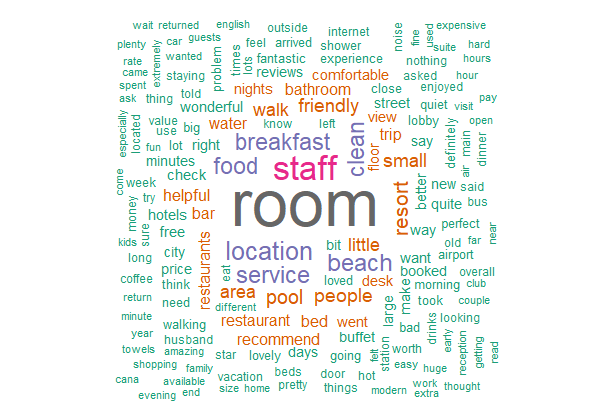
That is much more helpful! We can see from our word cloud that hotel reviews center on the room, followed by staff and then features like food, location, beach, service, breakfast and cleanliness. The words in light green, on the fringes, are those least frequently used in reviews.
Conclusions
We performed a bit of basic text manipulation using the tm package and made word clouds for the Tripadvisor hotel reviews. Recalling that hotel ratings were skewed to the right, we have visualized which features make for a positive hotel stay. Never underestimate the power of a clean room, friendly staff, and complimentary breakfast!